

A Comprehensive Guide to Understanding Road Accident Causes
Global and National Impact of Traffic Collisions
Road traffic crashes represent a persistent public health challenge both internationally and within our local communities. According to data from the World Health Organization (WHO), roadway collisions claim approximately 1.16 million lives globally each year, while non-fatal injuries affect between 20 million and 50 million individuals annually.
In the United States, traffic safety metrics reveal significant fluctuations over the past decade. National statistics show that 43,230 people were killed in motor vehicle crashes in 2021—the highest single-year total recorded since 2005. While fatalities slightly decreased to 42,514 in 2022 and roughly 40,990 in 2023, total losses remain elevated compared to pre-2020 baseline figures. In 2024, national traffic deaths stood at 39,254, representing a rate of 11.5 deaths per 100,000 population and 1.19 deaths per 100 million vehicle miles traveled (VMT).
State-by-state data demonstrates wide regional disparities across the nation. For example, in 2024, Mississippi recorded the highest per-capita fatality rate in the country at 25.6 deaths per 100,000 residents, whereas Rhode Island recorded the lowest rate at 4.7. Closer to home, Illinois recorded 1,177 motor vehicle crash fatalities in 2024, corresponding to a rate of 9.3 deaths per 100,000 population and 1.13 deaths per 100 million VMT. For motorists navigating local highways and municipal roadways, reviewing official Illinois State Police Crash Reports offers vital insight into regional safety trends and enforcement zones.
Global Mortality and Demographics
On a global scale, the burden of traffic mortality falls disproportionately on developing regions and vulnerable demographics. Low- and middle-income countries account for 92% of all global road traffic fatalities, despite possessing only about 60% of the world’s registered motor vehicles. The death rate in Africa is the highest worldwide at 24.1 per 100,000 inhabitants, compared to Europe’s rate of 10.3 per 100,000.
Demographic analyses underscore three key vulnerability patterns:
- Vulnerable Road Users: More than 50% of all global road traffic deaths occur among pedestrians, cyclists, and motorcyclists who lack the structural protection of enclosed vehicles.
- Children and Young Adults: Road traffic injuries constitute the single leading cause of death for children and young adults aged 5 to 29 years.
- Working-Age Population: Roughly two-thirds of all road traffic fatalities occur among adults in their prime working years (ages 18 to 59).
U.S. Fatality Trends and Regional Disparities
Within the U.S., analyzing fatality rates per capita versus vehicle miles traveled provides clear context on driver risk. Rural areas experience a disproportionate share of fatal crashes due to higher speed limits, two-lane undivided highways, and delayed access to emergency medical care. Nationwide in 2024, 41% of motor vehicle crash deaths occurred in rural environments, while 58% occurred in urban settings. Single-vehicle crashes accounted for 52% of total fatalities nationwide, though state figures varied wildly—Vermont recorded single-vehicle crashes in 78% of its fatal incidents, while Nebraska saw multi-vehicle collisions in 60% of its fatal crashes.
In dense urban environments like Cook County and surrounding areas, traffic volume introduces distinct risk profiles. Motorists and city planners tracking urban collision patterns can explore municipal data tools like the Chicago Traffic Crash Data portal to monitor local incident locations, collision types, and high-risk corridors.
Primary Risk Factors and Causes of Road Accidents
Traffic collisions rarely stem from a single isolated event. Historic studies on traffic safety indicate that human factors contribute to approximately 93% to 95% of all motor vehicle crashes, frequently interacting with road design deficiencies or temporary mechanical failures. Understanding the primary 10 Causes of Road Accidents helps drivers anticipate hazardous driving environments.
Human Factors and Driver Impairment
Driver behavior remains the dominant variable in fatal and non-fatal collisions. Key contributing behavioral factors include:
- Speeding: Excessive speed dramatically increases stopping distance and crash impact forces. Statistical models demonstrate that every 1% increase in mean vehicle speed produces a 4% increase in fatal crash risk and a 3% increase in serious crash risk. Nationwide, speeding was a contributing factor in 29% of all motor vehicle crash deaths in 2024.
- Substance Impairment: Driving under the influence of alcohol, illicit drugs, or prescription medications severely degrades motor control and reaction speed. Driver crash risk rises exponentially once Blood Alcohol Concentration (BAC) reaches or exceeds 0.04 g/dl, which is why enforcement of strict 0.08 BAC laws remains vital. Furthermore, using psychoactive substances like amphetamines can increase fatal crash risk by approximately 5 times.
- Distracted Driving: Mobile phone interaction creates profound visual, manual, and cognitive distractions. Drivers using mobile phones are approximately 4 times more likely to be involved in a crash than non-distracted drivers. Texting is particularly hazardous, elevating collision risk by up to 23 times, while dialing a handheld phone increases crash probability by 12 times. Research confirms that hands-free mobile units offer no significant safety advantage over handheld devices due to cognitive diversion.
- Driver Fatigue and Acute Medical Episodes: Operating a vehicle while severely fatigued compromises alertness similarly to alcohol impairment. Furthermore, sudden non-intoxication medical episodes can lead to complete loss of vehicle control. For example, emergency records detail instances such as a recent news report on coughing fit leading to crash, where an SUV driver suffered an acute coughing spell that resulted in multiple pedestrian casualties and vehicle damage.
Hazardous Road Infrastructure and Intersection Risks
Roadway engineering directly influences how human error manifests on the road. Infrastructure deficiencies include inadequate lighting, poorly positioned traffic control signals, dangerous sightlines, and lack of dedicated pedestrian footpaths or cycle lanes.
Transportation authorities monitor high-risk roadway segments by classifying them into “black spots” (isolated locations with high collision frequency) and continuous “black corridors” (extended stretches of highway recording high rates of fatal crashes). Complex roadway junctions present elevated risk; reviewing The Top 5 Reasons for Accidents at Intersections highlights how left-turn misjudgments, signal violations, and blind spots lead to broadside collisions.
Severe Collision Configurations and Highway Risks

Certain collision configurations carry a significantly higher likelihood of critical injury or fatal outcomes due to the violent transfer of kinetic energy.
- Head-On Collisions: Though representing a smaller percentage of total crashes, Head-On Collisions carry extreme fatality rates because the relative impact speeds of both oncoming vehicles combine upon impact.
- Stationary Vehicle Hazards: Disabled commercial vehicles or trucks parked along highway shoulders or active travel lanes create immense hazard zones for approaching traffic. A striking example involved a religious pilgrimage detailed in a news report on Delhi-Mumbai Expressway truck crash, where a passenger vehicle struck a stalled truck on the expressway shoulder, resulting in four fatalities and five severe injuries.
- Improper Overtaking Maneuvers: Abrupt lane changes or misjudged passing maneuvers on two-lane highways routinely cause catastrophic head-on or sideswipe pileups. This danger was demonstrated in a Mombasa Road multi-vehicle crash report, where a light vehicle attempted to overtake a heavy commercial trailer, cut back into the lane prematurely to avoid oncoming traffic, lost control, and triggered a fatal multi-vehicle collision.
Systemic Solutions and Effective Preventative Interventions
Preventing road accidents requires moving away from relying entirely on flawless driver behavior toward building forgiving transport systems.
The Safe System Approach to Transport Safety
The Safe System approach—advocated by global safety experts and international health organizations—operates on the premise that human beings will inevitably make errors while driving. Rather than assuming crash elimination can occur solely through driver discipline, the Safe System framework designs infrastructure, vehicles, and operational policies to absorb physical impact energy so that human tolerance thresholds are not exceeded.
Key pillars of this approach include:
- Establishing safe speed limits reflecting road environment and user mix
- Redesigning street networks with dedicated physical separation between pedestrians, motor vehicles, and cyclists
- Implementing rapid post-crash trauma response protocols to stabilize victims within the critical initial timeframe
Proven High-Impact Roadway Interventions
Systemic safety gains require combining passive regulatory enforcement with physical road engineering.
| Safety Intervention | Primary Mechanism | Demonstrated Effectiveness |
|---|---|---|
| Modern Roundabouts | Replaces 4-way intersections; forces reduced speeds and eliminates right-angle cross-traffic points | Reduces fatal and injury crashes by up to 78% compared to signalized junctions |
| Seat Belt Usage | Restrains vehicle occupants; prevents ejection during rollovers or high-speed impacts | Reduces mortality risk among front-seat occupants by up to 50% |
| Child Safety Seats | Secures infants and young children in age-appropriate harness systems | Reduces infant traffic crash fatalities by up to 71% |
| Automated Speed Cameras | Delivers continuous speed limit enforcement in high-risk corridors | Reduces average speeds and lowers fatal collision rates across target zones |
| Electronic Stability Control (ESC) | Automatically applies selective braking to individual wheels to correct oversteer/understeer | Significantly lowers single-vehicle loss-of-control and rollover crashes |
| Graduated Driver Licensing (GDL) | Phased licensing for novice drivers restricting night driving and youth passengers | Reduces teen driver crash involvement by 20% to 40% |
Sociodemographic Disparities and Economic Costs
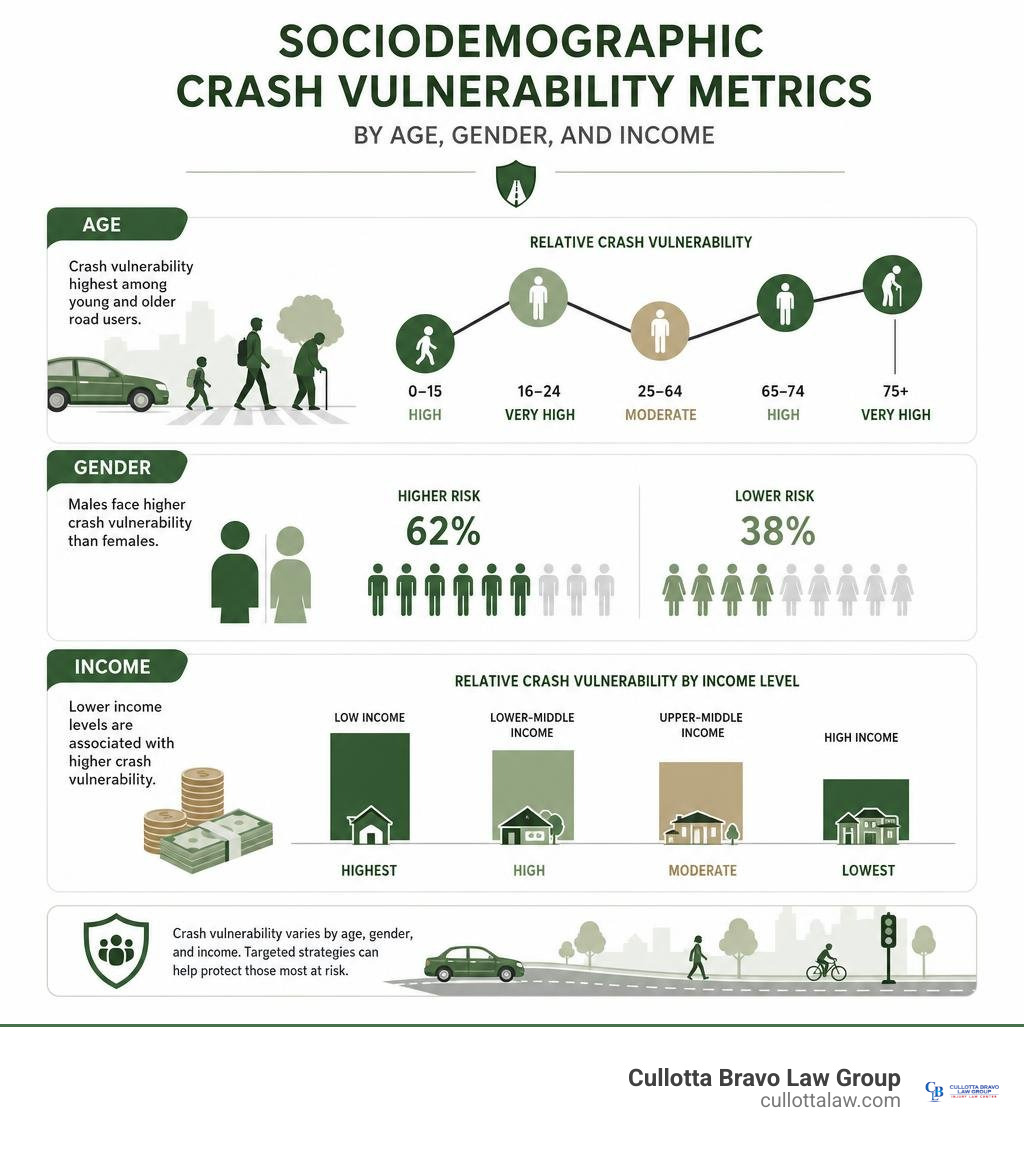
Traffic collisions do not affect all populations equally. Socioeconomic factors, age, gender, and regional economic stability heavily dictate personal crash vulnerability and economic fallout.
Sociodemographic Vulnerabilities in Road Accidents
Statistical data highlights consistent demographic trends regarding crash survival rates:
- Gender Disparity: Males are approximately 3 times more likely to be killed in road crashes than females worldwide. Male drivers demonstrate higher rates of speeding, non-use of seat belts, and impaired driving.
- Age Vulnerability: Young drivers aged 15 to 29 exhibit elevated risk due to inexperience and risk-taking behaviors. Conversely, elderly drivers face increased physical frailty, making them more susceptible to fatal complications from severe impact trauma.
- Socioeconomic Status: Individuals from lower socioeconomic backgrounds experience higher rates of pedestrian and non-motorized vehicle involvement, often navigating areas lacking adequate footpaths, lighting, or safe crossing infrastructure.
Understanding the Economic and Social Costs of Road Accidents
At a macro-economic level, road traffic crashes cost most countries approximately 3% of their Gross Domestic Product (GDP) each year in medical costs, property damage, emergency services, and lost workplace productivity. In some low- and middle-income nations, economic losses consume up to 6% of annual GDP.
For injured individuals and families navigating the aftermath of a severe crash, economic impacts become immediately personal. Victims face staggering medical bills, lost wages during recovery, and ongoing rehabilitation costs. Establishing legal liability and financial recovery often requires comprehensive guidance; reviewing our Car Accident Attorney Complete Guide clarifies how legal representation aids injured victims during insurance claims.
In jurisdictions like Illinois, recovering compensation depends on understanding statutory liability standards. Exploring Understanding Comparative Fault in Illinois Car Accident Cases helps crash victims understand how fault allocation impacts total financial recovery when multiple parties share responsibility.
Terminology Debate: Why Experts Avoid the Word ‘Accident’
Public health agencies, law enforcement divisions, and legal professionals have actively shifted terminology away from the traditional word “accident,” adopting terms like “crash,” “collision,” or “traffic incident.”
Safety experts argue that the word “accident” implies an unavoidable event caused by random bad luck or fate. In reality, the vast majority of motor vehicle collisions result from clear human error, dangerous road design, mechanical neglect, or reckless driving. Labeling a preventable speed- or alcohol-related collision as an “accident” subtly exonerates negligent parties and undermines public awareness regarding driver accountability. Official style guides across transportation departments now mandate “crash” or “collision” to reinforce that roadway safety remains entirely within human control.
Frequently Asked Questions About Traffic Collisions
Why do safety organizations prefer ‘crash’ over ‘accident’?
Safety organizations use “crash” or “collision” because the term “accident” implies that an event was unpredictable and unpreventable. Because research shows that roughly 93% to 95% of traffic incidents result from driver behaviors like speeding, impairment, distraction, or poor infrastructure design, using “crash” correctly frames collisions as preventable events rooted in human action or engineering design.
What is the Safe System approach in traffic engineering?
The Safe System approach is a holistic transportation framework that accepts human error as inevitable and designs roads, vehicles, and operational policies to accommodate those mistakes. It focuses on keeping impact forces below the thresholds that cause death or serious injury through physical traffic calming, forgiving roadside infrastructure, reduced speed limits, modern roundabouts, and advanced vehicle safety technologies.
Which states have the highest traffic fatality rates in the U.S.?
Fatality rates vary significantly across states based on population, road design, speed limits, and travel habits. In 2024, Mississippi recorded the highest state traffic death rate per capita at 25.6 per 100,000 population. Conversely, Rhode Island recorded the lowest death rate per capita at 4.7 per 100,000. Rural states with extensive open highway miles frequently exhibit higher per-capita fatality rates than densely populated urban states.
Conclusion
Understanding the multi-faceted causes of road accidents highlights a central truth: the vast majority of serious traffic crashes are entirely preventable. Reducing national and global mortality requires continuous progress across multiple fronts—enforcing strict impairment and speed laws, adopting forgiving Safe System infrastructure, utilizing personal occupant restraints, and eliminating phone distractions behind the wheel.
When preventative measures fail and negligent driving leads to physical injuries, victims need clear legal support to navigate insurance claims and secure fair compensation. Our team at Cullotta Bravo Law Group brings over 35 years of dedicated legal experience to injured drivers, pedestrians, and families across Northern Illinois. If you or a loved one has suffered injuries in a motor vehicle collision, consult an experienced Car Accident Lawyer in Aurora to explore your legal recovery options and protect your financial future.